
Written on December 5, 2021
Simple Map Plots in R
Most articles written about using R for map visualization focus on using libraries such as ggplot2 and others to enable sophisticated plotting options. However, many times this isn’t needed as sf (and most other spatial packages) supports basic plotting operations natively. This post captures a some simple techniques that can be used for rapid visualizations to validate assumptions and find problems.
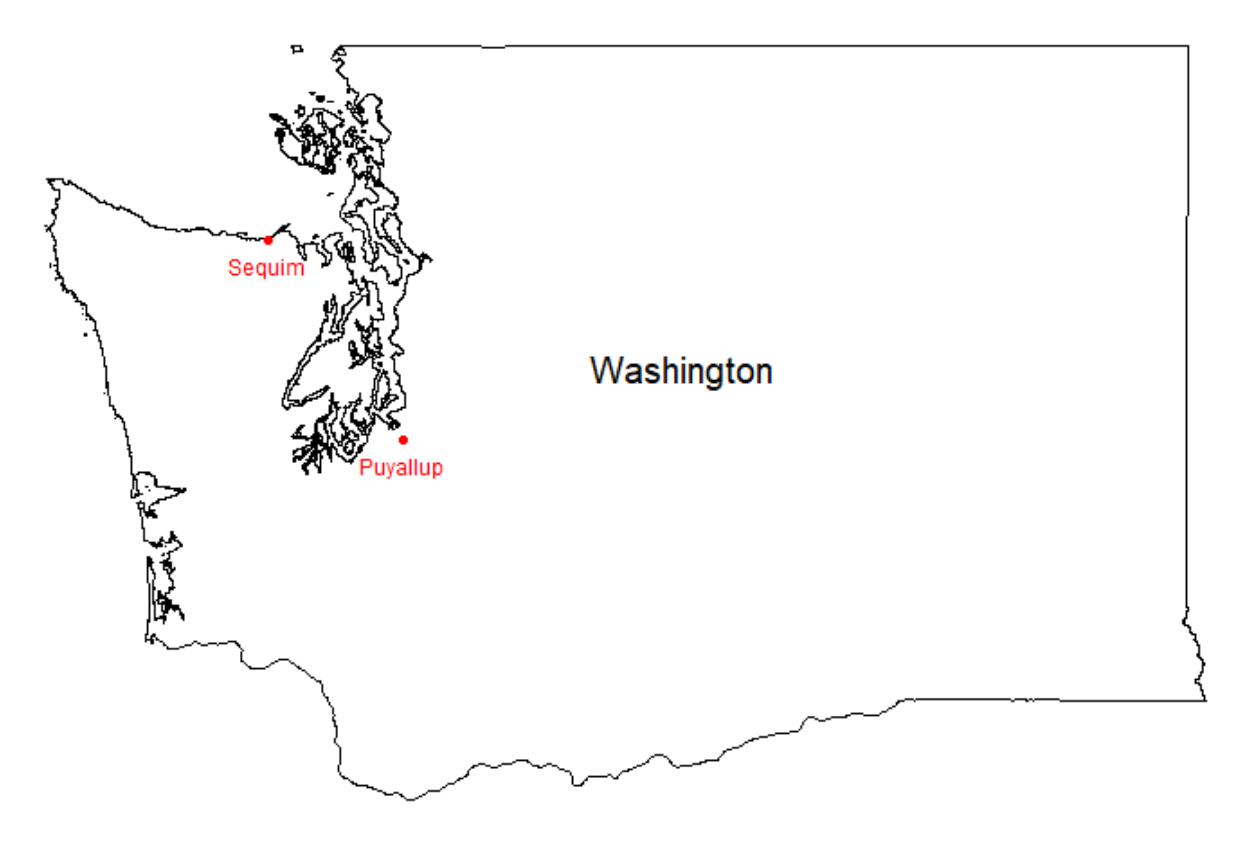
Plot 1:
Code
library(sf)
library(dplyr)

wa_state <- st_read("C:/Users/RAndre1/Documents/Work_Docs/GIS_DATA/wa_state.shp")
wa_cities <- st_read("C:/Users/RAndre1/Documents/Work_Docs/GIS_DATA/sample_wa_cities.shp")

plot(wa_state$geometry)
plot(wa_cities$geometry, add = TRUE, pch=20, col='red')
text(st_coordinates(wa_cities), pos=1, wa_cities$Name, cex=0.75, col = 'red')

st_centroid(wa_state) %>%
  st_coordinates() %>%
  text(pos=3, wa_state$Name, cex=1.25)
R_Hacks